
A small challenge 🤔: Take a regular ruler and measure the height of a person. Now ask a friend to measure the same person with the same ruler. I bet your numbers will differ a bit! 😄 So the question is: who was right? The surprising answer is: maybe neither of you said it “exactly” — and that’s not your fault, it’s a fundamental fact of physics. Let’s see why 👇
The bitter truth: Error is always present!
Factor Two: The Experimenter’s Skill (and a fun trap!) 👁️
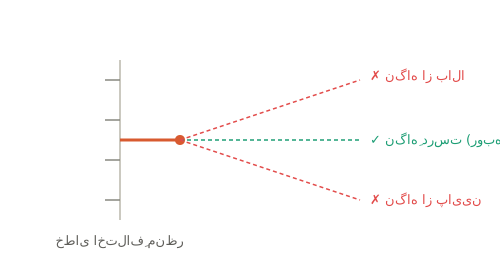
Here’s something really interesting. Even with the best instrument, if you don’t read it correctly, you still have an error! One of the most famous errors is the parallax error (Parallax).
What does that mean? Imagine you’re looking at a ruler or a dial of a device from the side, not straight on. Then the number you read differs from the true value! 🤨
A everyday example 🚗: In a car, the driver sees one number on the speedometer, but a passenger sitting beside and looking from a different angle might see a slightly different number. That’s why you should always look at the instrument straight on and perpendicular 🎯.
Factor Three: Repetition and Averaging 🔁
A clever trick to reduce error: repeat the measurement several times and take the average.
Why does it work? Because errors are usually random — one time you read a little high, another time a little low. When you average, these random errors cancel each other out and you get closer to the true value ✅.
But a subtle point 💡: if among your numbers one or two are much different from the rest (e.g., you got ten numbers around 5 and suddenly one is 50!), don’t include that outlier in the average — it was probably a clear mistake.
Precision vs. Accuracy: Two Different Things! 🎯
Here’s an extremely important point that many people mix up. In everyday language we treat “precise” and “accurate” as the same, but in physics they differ:
Accuracy: how close you are to the true value. Precision: how close your measurements are to each other (repeatable).
A great example with a clock ⏰: a digital clock that shows the time down to the second is very precise, but if it runs a few minutes slow, it’s not correct! Conversely, an old wall clock might show the correct time but because it lacks a second hand, its precision is low.
The best way to understand this difference is the game of Dart 🎯:
🎮 Click on the buttons and see the three different states of precision and correctness on the dartboard.
- Both precise and correct: All darts are in the center of the target and close to each other 🎯
- Precise but incorrect: All darts are close to each other, but in a corner (not the center)
- Neither precise nor correct: The darts are scattered everywhere 🤷
High-quality measurements — like those used to define standards — must be both precise and correct.
My informal summary 🎁
No measurement is error‑free; our job is to reduce error, not eliminate it. To do this: choose a precise instrument, read from the front (watch out for parallax!), repeat several times and take the average. And remember, “precise” and “correct” are different — one means repeatable, the other means close to reality 😎.
The “Interesting to Know” box: Meaningful figures 💡
When you measure a quantity, the numbers you write are called meaningful figures. An important rule: when you multiply or divide numbers, the number of meaningful figures in the result cannot exceed the smallest number of meaningful figures among the original numbers.
Example: If you multiply 3.1415 (five digits) by 2.9 (two digits), the answer should be written with two meaningful digits, not more! Why? Because you can’t get a more precise answer from a low‑precision measurement 😄. It’s like a chain — it’s only as strong as its weakest link.
Assess yourself 📝
Click on any question to reveal its answer 👇
Analysis with Python 🐍
Error, precision, accuracy — with real data! 🎯
Remember we said that repetition and averaging reduces error? Let’s see exactly how much:
import numpy as np
import matplotlib.pyplot as plt

rng = np.random.default_rng(42)
TRUE_VALUE = 15.0  # true value (e.g., length of an object in cm)

# Three types of measurements — 15 trials each
precise_correct  = rng.normal(TRUE_VALUE, 0.3, 15)        # precise and accurate
precise_wrong    = rng.normal(TRUE_VALUE + 2.5, 0.3, 15)  # precise but inaccurate
imprecise        = rng.normal(TRUE_VALUE, 1.5, 15)        # imprecise

fig, axes = plt.subplots(1, 3, figsize=(13, 4.5), sharey=True)
configs = [
    (precise_correct, 'Precise & Accurate', '#27ae60'),
    (precise_wrong,   'Precise but Inaccurate', '#e67e22'),
    (imprecise,       'Imprecise', '#e74c3c'),
]

for ax, (data, title, color) in zip(axes, configs):
    ax.axvline(TRUE_VALUE, color='black', lw=2, ls='--', label=f'True={TRUE_VALUE}')
    ax.axvline(np.mean(data), color=color, lw=2, label=f'Mean={np.mean(data):.2f}')
    ax.scatter(data, np.ones_like(data) + rng.uniform(-0.05, 0.05, len(data)),
               color=color, alpha=0.7, s=50, zorder=5)
    ax.fill_betweenx([0.85, 1.15],
                     np.mean(data)-np.std(data), np.mean(data)+np.std(data),
                     alpha=0.2, color=color)
    ax.set_title(f'{title}nStd dev: {np.std(data):.2f}', fontweight='bold', color=color)
    ax.set_xlabel('Measured value (cm)')
    ax.legend(fontsize=8); ax.set_ylim(0.5, 1.5); ax.set_yticks([])
    ax.grid(axis='x', alpha=0.3)
    err = abs(np.mean(data) - TRUE_VALUE)
    ax.text(0.5, 0.05, f'Error from truth: {err:.2f} cm',
            transform=ax.transAxes, ha='center', fontsize=9,
            color='darkblue', fontweight='bold')

plt.suptitle('Precision vs. Accuracy in measurement', fontsize=13, fontweight='bold')
plt.tight_layout()
plt.savefig('accuracy_precision.png', dpi=120, bbox_inches='tight')
plt.show()

print("Summary:")
print(f"{'Type':<28} {'Mean':>8} {'Std Dev':>10} {'Error from truth':>18}")
print("-"*68)
for data, title, _ in configs:
    print(f"{title:<28} {np.mean(data):>8.2f} {np.std(data):>10.2f} {abs(np.mean(data)-TRUE_VALUE):>18.2f}")
🤓 Challenge: Change
n=15ton=100. You’ll see the average of the “imprecise” gets much closer to reality — that’s the power of averaging!
Resources and Further Reading 📚
Wikipedia
- Measurement error — Persian Wikipedia
- Observational error — Wikipedia EN
- Accuracy and precision — Wikipedia EN
- Significant figures — Wikipedia EN
Video — YouTube 🎬
- Khan Academy: Accuracy vs Precision
- Veritasium: Is Most Published Research Wrong? — about the importance of accuracy in experiments
- Physics Girl: Measurement uncertainty explained
Video — Aparat 🎬
Simulator
On this site 🔗
In the next section — the final subsection of this chapter — we’ll explore a tasty and practical concept: __density 🧊. Why ice floats on water while a stone sinks, and why a tiny piece of aluminum can weigh half a kilogram! See you 👋
🔧 Read the Vernier caliper — interactive exercise
Use the slider to change the size and see how the main ruler and Vernier are read:
Have a question? 🤔
If something isn't clear or you have a question, ask it here. The answer will be published on this page.
💬 جواب بهتری داری؟ یا یه سؤال جدید؟
اگه به سؤالای بالا پاسخی داری که فکر میکنی روشنتر یا کاملتر از مال منه، یا یه سؤال جدید برای دانشآموزای دیگه داری — تو بخش نظرات پایین صفحه ارسال کن. هر پیامی رو میخونم، تأیید میکنم و منتشر میشه. اینجوری همه از تجربهی همدیگه استفاده میکنیم. 🌱